Fantasy Football Cheat Sheet
All positions ranked with analyst notes and live injury status.
This fantasy football draft cheat sheet ranks every position by tier for PPR scoring, with projections, live injury status, and analyst notes. Players are grouped QB, RB, WR, TE, K, and DST, so you can always take the best available player and see where each tier drops off.
Drafted already? Get the weekly edge.
Free start/sit calls, waiver targets and updated rankings, straight to your inbox each week of the season. No spam, unsubscribe anytime.
QB24 players
| RK | Player | Team | Proj | Tier | Note |
|---|---|---|---|---|---|
| Tier 1 | |||||
| 1 |  Josh Allen |
BUF | 24.4 | T1 | Elite 24.4 pt QB projection makes him a worthwhile early QB selection for dual-threat upside. |
| 2 |  Drake Maye |
NE | 22.3 | T1 | Strong 22.3 pt QB projection as a rookie starter provides excellent dual-threat upside at the position. |
| 3 |  Dak Prescott |
DAL | 22.0 | T1 | Solid 22 pt projection maintains Prescott as an elite QB option in Dallas' pass-heavy scheme. |
| Tier 2 | |||||
| 4 |  Joe Burrow |
CIN | 21.4 | T2 | Strong 21.4 pt QB projection makes Cincinnati's star passer a premium play at the position. |
| 5 |  Trevor Lawrence |
JAX | 21.1 | T2 | Solid 21.1 pt QB projection reflects Jacksonville's offensive system supporting strong QB scoring. |
| 6 |  Lamar Jackson OUT |
BAL | 20.0 | T2 | Solid 20 pt QB projection reflects Baltimore's run-heavy scheme potentially limiting passing volume for the MVP-caliber talent. |
| 7 |  Jacoby Brissett |
ARI | 18.9 | T2 | |
| 8 |  Bryce Young |
CAR | 18.2 | T2 | |
| Tier 3 | |||||
| 9 |  Kyler Murray |
MIN | 18.0 | T3 | |
| 10 |  Jayden Daniels |
WAS | 17.8 | T3 | |
| 11 |  Jordan Love |
GB | 17.1 | T3 | |
| 12 |  Patrick Mahomes |
KC | 17.1 | T3 | |
| 13 |  Geno Smith |
NYJ | 16.8 | T3 | |
| 14 |  Kirk Cousins |
LV | 16.5 | T3 | |
| Tier 4 | |||||
| 15 |  Baker Mayfield |
TB | 16.5 | T4 | |
| 16 |  Sam Darnold |
SEA | 16.3 | T4 | |
| 17 |  Jared Goff |
DET | 16.2 | T4 | |
| 18 |  Matthew Stafford |
LAR | 15.9 | T4 | |
| 19 |  Aaron Rodgers |
PIT | 15.8 | T4 | |
| 20 |  Caleb Williams |
CHI | 15.8 | T4 | |
| 21 |  Michael Penix Jr. |
ATL | 15.2 | T4 | |
| 22 |  Cam Ward |
TEN | 14.2 | T4 | |
| Tier 5 | |||||
| 23 |  Bo Nix |
DEN | 14.1 | T5 | |
| 24 |  Malik Willis |
MIA | 13.9 | T5 | |
RB60 players
| RK | Player | Team | Proj | Tier | Note |
|---|---|---|---|---|---|
| Tier 1 | |||||
| 1 |  Jahmyr Gibbs |
DET | 23.1 | T1 | Strong projection (23.1 pts) as the lead RB in Detroit's offense provides high floor with touchdown upside. |
| 2 |  Bijan Robinson |
ATL | 21.2 | T1 | High projection (21.2 pts) suggests significant workload as Atlanta's lead back, but monitor for actual touches vs. game script. |
| 3 |  Kenneth Walker III |
KC | 20.9 | T1 | Respectable 20.9 pt projection provides solid value as Kansas City's primary RB option. |
| Tier 2 | |||||
| 4 |  Kyren Williams |
LAR | 19.7 | T2 | 19.7 pt projection as the Rams' lead back provides solid PPR value in a pass-heavy offense. |
| 5 |  Javonte Williams |
DAL | 19.3 | T2 | 19.3 pt projection shows Dallas' RB role has significant scoring potential in a high-powered offense. |
| 6 |  Jonathan Taylor |
IND | 18.8 | T2 | 18.8 pt projection indicates solid role in Indianapolis' offense, though consistency depends on game flow. |
| 7 |  Chase Brown |
CIN | 17.7 | T2 | 17.7 pt projection suggests a featured role in Cincinnati's backfield committee. |
| 8 |  Chuba Hubbard |
CAR | 16.8 | T2 | 16.8 pt projection indicates he holds significant backfield role in Carolina's offense. |
| Tier 3 | |||||
| 9 |  Ashton Jeanty |
LV | 16.5 | T3 | 16.5 pt projection suggests meaningful role in Las Vegas' backfield. |
| 10 |  James Cook III |
BUF | 16.2 | T3 | 16.2 pt projection reflects established backup/committee role in Buffalo's backfield. |
| 11 |  Derrick Henry |
BAL | 15.9 | T3 | 15.9 pt projection at age 31 in Baltimore's system provides veteran workhorse value in a run-heavy approach. |
| 12 |  Bucky Irving |
TB | 15.7 | T3 | 15.7 pt projection suggests backfield role in Tampa Bay's offense. |
| 13 |  Josh Jacobs |
GB | 15.5 | T3 | 15.5 pt projection reflects established role in Green Bay's backfield. |
| 14 |  Saquon Barkley Q |
PHI | 15.0 | T3 | 15 pt projection for an elite RB talent signals potential role concerns or timeshare in Philadelphia. |
| Tier 4 | |||||
| 15 |  Jaylen Warren |
PIT | 15.0 | T4 | 15 pt projection suggests meaningful backfield involvement in Pittsburgh's offense. |
| 16 |  Breece Hall OUT |
NYJ | 14.8 | T4 | 14.8 pt projection indicates secondary role in New York's backfield despite talent level. |
| 17 |  Bhayshul Tuten |
JAX | 13.9 | T4 | 13.9 pt projection indicates depth or reserve role in Jacksonville's backfield. |
| 18 |  D'Andre Swift |
CHI | 13.0 | T4 | 13 pt projection shows limited role or committee status in Chicago's backfield. |
| 19 |  Ollie Gordon II |
MIA | 12.9 | T4 | 12.9 pt projection suggests depth or reserve status in Miami's backfield. |
| 20 |  Jordan Mason |
MIN | 10.9 | T4 | |
| 21 |  Tony Pollard |
TEN | 10.7 | T4 | |
| 22 |  Rhamondre Stevenson |
NE | 10.7 | T4 | |
| Tier 5 | |||||
| 23 |  Rachaad White |
WAS | 10.5 | T5 | |
| 24 |  Omarion Hampton |
LAC | 10.1 | T5 | |
| 25 |  Jonah Coleman |
DEN | 10.1 | T5 | |
| 26 |  Jeremiyah Love OUT |
ARI | 9.9 | T5 | |
| 27 |  Quinshon Judkins |
CLE | 9.6 | T5 | |
| 28 |  Aaron Jones Sr. Q |
MIN | 9.3 | T5 | |
| 29 |  Zach Charbonnet OUT |
SEA | 9.1 | T5 | |
| 30 | 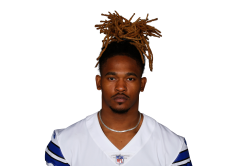 Rico Dowdle |
PIT | 8.9 | T5 | |
| Tier 6 | |||||
| 31 | 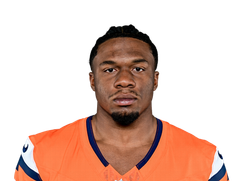 RJ Harvey |
DEN | 8.3 | T6 | |
| 32 | 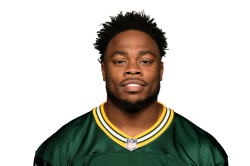 Emanuel Wilson |
SEA | 8.0 | T6 | |
| 33 | 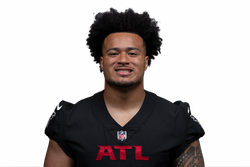 Tyler Allgeier |
ARI | 7.9 | T6 | |
| 34 |  Braelon Allen |
NYJ | 7.7 | T6 | |
| 35 |  Tyjae Spears OUT |
TEN | 7.6 | T6 | |
| 36 |  TreVeyon Henderson |
NE | 7.4 | T6 | |
| 37 |  Blake Corum |
LAR | 7.4 | T6 | |
| 38 | 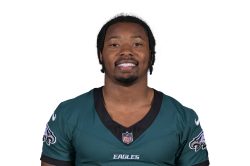 Kenny Gainwell |
TB | 7.4 | T6 | |
| 39 |  Samaje Perine |
CIN | 6.7 | T6 | |
| 40 | 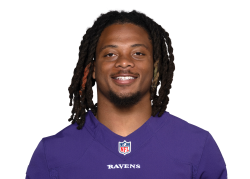 Keaton Mitchell |
LAC | 6.6 | T6 | |
| 41 | 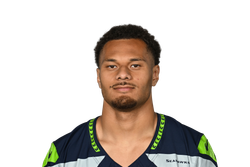 George Holani |
SEA | 6.5 | T6 | |
| 42 |  Kimani Vidal |
LAC | 6.2 | T6 | |
| 43 |  Kyle Monangai OUT |
CHI | 6.1 | T6 | |
| 44 | 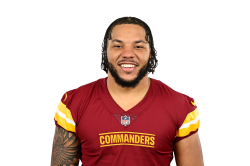 Chris Rodriguez Jr. |
JAX | 5.9 | T6 | |
| 45 |  Dylan Sampson |
CLE | 5.9 | T6 | |
| 46 |  Zonovan Knight |
ARI | 5.9 | T6 | |
| 47 |  Justice Hill |
BAL | 5.8 | T6 | |
| 48 |  Mike Washington Jr. |
LV | 5.7 | T6 | |
| 49 |  J.K. Dobbins |
DEN | 5.7 | T6 | |
| 50 |  Austin Ekeler |
WAS | 5.6 | T6 | |
| 51 |  Ty Johnson |
BUF | 5.3 | T6 | |
| 52 |  MarShawn Lloyd |
GB | 5.2 | T6 | |
| 53 |  Corey Kiner |
NE | 5.1 | T6 | |
| 54 |  Brian Robinson Jr. OUT |
ATL | 4.4 | T6 | |
| 55 |  Emmett Johnson |
KC | 4.3 | T6 | |
| 56 |  Jaylen Wright Q |
MIA | 4.2 | T6 | |
| 57 |  Tyler Goodson |
DAL | 3.8 | T6 | |
| 58 |  Sione Vaki |
DET | 3.8 | T6 | |
| 59 |  Dameon Pierce |
PHI | 3.5 | T6 | |
| 60 |  Jeremy McNichols |
WAS | 2.9 | T6 | |
WR60 players
| RK | Player | Team | Proj | Tier | Note |
|---|---|---|---|---|---|
| Tier 1 | |||||
| 1 |  Jaxon Smith-Njigba |
SEA | 25.1 | T1 | Elite projection (25.1 pts) as the clear WR1 makes him a premium selection despite injury concerns requiring monitoring. |
| 2 |  Puka Nacua |
LAR | 21.6 | T1 | Solid projection (21.6 pts) locks in significant volume as the Rams' top receiving option in an elite passing attack. |
| 3 |  CeeDee Lamb |
DAL | 20.8 | T1 | Consistent 20.8 pt projection reflects elite volume as Dallas' WR1, though consistency can fluctuate with defensive attention. |
| Tier 2 | |||||
| 4 |  Ja'Marr Chase |
CIN | 19.9 | T2 | Elite talent with 19.9 pt projection remains a top-tier WR despite slightly lower scoring than some peers. |
| 5 |  Justin Jefferson |
MIN | 18.3 | T2 | 18.3 pt projection slightly below elite peers raises questions about Minnesota's pass volume or distribution. |
| 6 |  Zay Flowers |
BAL | 18.0 | T2 | 18 pt projection as Baltimore's pass-catchers shows he's earned meaningful volume in the Ravens' offense. |
| 7 |  Amon-Ra St. Brown Q |
DET | 17.2 | T2 | 17.2 pt projection reflects solid WR volume in Detroit's high-volume passing attack. |
| 8 |  Drake London |
ATL | 17.1 | T2 | 17.1 pt projection shows Atlanta's WR room has him positioned for meaningful targets. |
| Tier 3 | |||||
| 9 |  Christian Watson |
GB | 16.5 | T3 | 16.5 pt projection reflects established WR role in Green Bay's pass attack. |
| 10 |  Garrett Wilson |
NYJ | 16.3 | T3 | 16.3 pt projection as New York's primary WR option provides high-volume opportunity in the passing game. |
| 11 |  Jalen Coker Q |
CAR | 16.1 | T3 | 16.1 pt projection shows Carolina has integrated him into the passing attack significantly. |
| 12 |  Tee Higgins |
CIN | 16.0 | T3 | 16 pt projection indicates solid role in Cincinnati's WR room despite elite talent level. |
| 13 |  Michael Wilson |
ARI | 15.8 | T3 | 15.8 pt projection shows he's earned consistent target share in Arizona's offense. |
| 14 |  Parker Washington |
JAX | 15.6 | T3 | 15.6 pt projection indicates developing role in Jacksonville's passing game. |
| Tier 4 | |||||
| 15 |  A.J. Brown |
NE | 15.3 | T4 | 15.3 pt projection despite elite talent raises concerns about New England's offensive volume or scheme fit. |
| 16 |  DJ Moore Q |
BUF | 14.4 | T4 | 14.4 pt projection for an elite WR1 talent raises red flags about actual volume or usage in Buffalo. |
| 17 |  Tetairoa McMillan |
CAR | 14.3 | T4 | 14.3 pt projection shows Arizona is deploying the rookie receiver with meaningful opportunity. |
| 18 |  George Pickens |
DAL | 14.2 | T4 | 14.2 pt projection reflects secondary or competition-driven role in Dallas' pass attack. |
| 19 | 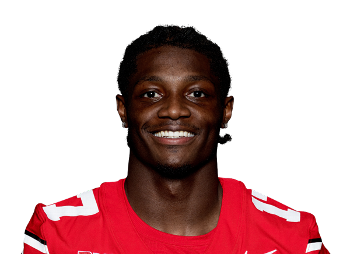 Carnell Tate |
TEN | 13.6 | T4 | 13.6 pt projection shows Tennessee's receiver is seeing targeted opportunities in the passing game. |
| 20 | 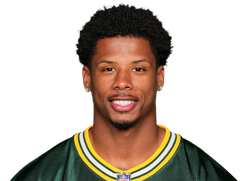 Matthew Golden Q |
GB | 13.3 | T4 | 13.3 pt projection reflects depth or limited opportunity status in Green Bay's WR room. |
| 21 |  Rashee Rice OUT |
KC | 12.7 | T4 | 12.7 pt projection indicates significantly reduced role in Kansas City's offense. |
| 22 |  DeVonta Smith OUT |
PHI | 12.5 | T4 | |
| Tier 5 | |||||
| 23 | 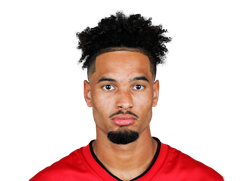 Emeka Egbuka OUT |
TB | 11.9 | T5 | |
| 24 | 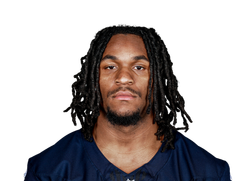 Luther Burden III |
CHI | 11.7 | T5 | |
| 25 |  Stefon Diggs |
WAS | 11.7 | T5 | |
| 26 |  Jaylen Waddle Q |
DEN | 11.3 | T5 | |
| 27 |  DK Metcalf |
PIT | 11.3 | T5 | |
| 28 |  Wan'Dale Robinson |
TEN | 11.1 | T5 | |
| 29 |  Chris Godwin Jr. |
TB | 10.6 | T5 | |
| 30 |  Ladd McConkey Q |
LAC | 10.3 | T5 | |
| Tier 6 | |||||
| 31 |  Denzel Boston |
CLE | 10.3 | T6 | |
| 32 |  Jakobi Meyers |
JAX | 10.2 | T6 | |
| 33 |  Rome Odunze |
CHI | 10.1 | T6 | |
| 34 |  Jameson Williams |
DET | 10.1 | T6 | |
| 35 |  Germie Bernard |
PIT | 10.1 | T6 | |
| 36 |  Josh Downs |
IND | 9.9 | T6 | |
| 37 |  Omar Cooper Jr. |
NYJ | 9.8 | T6 | |
| 38 |  Kendrick Bourne |
ARI | 9.5 | T6 | |
| 39 |  Tre Tucker |
LV | 9.4 | T6 | |
| 40 |  Malik Washington |
MIA | 9.3 | T6 | |
| 41 |  Xavier Worthy |
KC | 9.1 | T6 | |
| 42 |  Jordan Addison |
MIN | 9.1 | T6 | |
| 43 |  KC Concepcion Jr. |
CLE | 9.1 | T6 | |
| 44 |  Keenan Allen |
IND | 9.0 | T6 | |
| 45 |  Khalil Shakir |
BUF | 8.9 | T6 | |
| 46 |  DeMario Douglas |
NE | 8.8 | T6 | |
| 47 |  Ryan Flournoy |
DAL | 8.7 | T6 | |
| 48 |  Keon Coleman |
BUF | 7.6 | T6 | |
| 49 |  Cooper Kupp |
SEA | 7.5 | T6 | |
| 50 |  Courtland Sutton |
DEN | 7.4 | T6 | |
| 51 |  Antonio Williams |
WAS | 7.1 | T6 | |
| 52 |  Caleb Douglas |
MIA | 6.9 | T6 | |
| 53 |  Quentin Johnston |
LAC | 6.7 | T6 | |
| 54 |  Kalif Raymond |
CHI | 6.5 | T6 | |
| 55 |  Rashid Shaheed Q |
SEA | 6.5 | T6 | |
| 56 |  Elic Ayomanor |
TEN | 6.2 | T6 | |
| 57 |  Jauan Jennings |
MIN | 6.1 | T6 | |
| 58 |  Dontayvion Wicks OUT |
PHI | 6.0 | T6 | |
| 59 |  Ja'Kobi Lane |
BAL | 5.8 | T6 | |
| 60 |  Jahan Dotson |
ATL | 5.7 | T6 | |
TE24 players
| RK | Player | Team | Proj | Tier | Note |
|---|---|---|---|---|---|
| Tier 1 | |||||
| 1 |  Trey McBride |
ARI | 19.2 | T1 | 19.2 pt projection is exceptional for the tight end position, making him a potential league-winner at the position. |
| 2 |  Brock Bowers |
LV | 16.9 | T1 | 16.9 pt projection as a rookie TE1 is exceptional and provides tremendous upside at the position. |
| 3 |  Travis Kelce |
KC | 11.5 | T1 | |
| Tier 2 | |||||
| 4 |  T.J. Hockenson |
MIN | 11.1 | T2 | |
| 5 |  Sam LaPorta |
DET | 11.1 | T2 | |
| 6 |  Tyler Warren OUT |
IND | 10.9 | T2 | |
| 7 |  Tucker Kraft |
GB | 10.8 | T2 | |
| 8 |  Brenton Strange |
JAX | 10.5 | T2 | |
| Tier 3 | |||||
| 9 |  Harold Fannin Jr. |
CLE | 10.4 | T3 | |
| 10 |  Dallas Goedert |
PHI | 10.3 | T3 | |
| 11 |  Dalton Kincaid |
BUF | 10.3 | T3 | |
| 12 |  Hunter Henry |
NE | 9.6 | T3 | |
| 13 |  Colston Loveland |
CHI | 9.5 | T3 | |
| 14 |  Jake Ferguson |
DAL | 9.5 | T3 | |
| Tier 4 | |||||
| 15 |  Pat Freiermuth |
PIT | 9.2 | T4 | |
| 16 |  Kenyon Sadiq |
NYJ | 8.8 | T4 | |
| 17 |  Mark Andrews |
BAL | 8.8 | T4 | |
| 18 |  Mike Gesicki |
CIN | 8.7 | T4 | |
| 19 |  Kyle Pitts Sr. |
ATL | 8.5 | T4 | |
| 20 |  Tyler Higbee |
LAR | 8.4 | T4 | |
| 21 |  AJ Barner |
SEA | 8.4 | T4 | |
| 22 |  Cade Otton |
TB | 8.2 | T4 | |
| Tier 5 | |||||
| 23 |  Darren Waller |
CAR | 7.7 | T5 | |
| 24 |  Michael Mayer |
LV | 7.4 | T5 | |
K16 players
| RK | Player | Team | Proj | Tier | Note |
|---|---|---|---|---|---|
| Tier 1 | |||||
| 1 |  Brandon Aubrey |
DAL | 9.9 | T1 | |
| 2 |  Spencer Shrader |
IND | 9.4 | T1 | |
| 3 |  Will Reichard |
MIN | 9.3 | T1 | |
| Tier 2 | |||||
| 4 |  Evan McPherson |
CIN | 9.2 | T2 | |
| 5 |  Cam Little |
JAX | 9.1 | T2 | |
| 6 |  Chase McLaughlin |
TB | 8.8 | T2 | |
| 7 |  Trey Smack |
GB | 8.8 | T2 | |
| 8 |  Jason Myers |
SEA | 8.6 | T2 | |
| Tier 3 | |||||
| 9 |  Matt Gay |
LV | 8.5 | T3 | |
| 10 |  Drew Stevens |
WAS | 8.5 | T3 | |
| 11 |  Jake Bates |
DET | 8.4 | T3 | |
| 12 |  Chad Ryland |
ARI | 8.1 | T3 | |
| 13 |  Chris Boswell |
PIT | 8.1 | T3 | |
| 14 |  Tyler Bass |
BUF | 8.0 | T3 | |
| Tier 4 | |||||
| 15 |  Harrison Butker |
KC | 7.7 | T4 | |
| 16 |  Ryan Fitzgerald |
CAR | 7.7 | T4 | |
DEF16 players
| RK | Player | Team | Proj | Tier | Note |
|---|---|---|---|---|---|
| Tier 1 | |||||
| 1 |  Cincinnati Bengals |
CIN | 9.8 | T1 | 9.8 pt DEF projection indicates solid defensive production expected from the Bengals this season. |
| 2 |  New England Patriots |
NE | 9.3 | T1 | 9.3 pt DEF projection indicates below-average defensive scoring expected from New England this season. |
| 3 |  Pittsburgh Steelers |
PIT | 8.9 | T1 | |
| Tier 2 | |||||
| 4 |  Jacksonville Jaguars |
JAX | 8.9 | T2 | |
| 5 |  Los Angeles Rams |
LAR | 8.8 | T2 | |
| 6 |  Washington Commanders |
WAS | 8.2 | T2 | |
| 7 |  Kansas City Chiefs |
KC | 8.0 | T2 | |
| 8 |  Seattle Seahawks |
SEA | 6.9 | T2 | |
| Tier 3 | |||||
| 9 |  Tampa Bay Buccaneers |
TB | 6.6 | T3 | |
| 10 |  Atlanta Falcons |
ATL | 6.6 | T3 | |
| 11 |  Las Vegas Raiders |
LV | 6.5 | T3 | |
| 12 |  Dallas Cowboys |
DAL | 6.5 | T3 | |
| 13 |  New York Jets |
NYJ | 6.4 | T3 | |
| 14 |  Green Bay Packers |
GB | 6.4 | T3 | |
| Tier 4 | |||||
| 15 |  Buffalo Bills |
BUF | 6.4 | T4 | |
| 16 |  Minnesota Vikings |
MIN | 6.4 | T4 | |